Reproducible Science Workshop at iDigBio
Cross-posted from the iDigBio blog.
Reproducibility is one of the corner stones of the scientific process. Readers should be able to figure out how you generate the numbers (e.g., statistics and p-values) found in your manuscript, and the origin of the data points that are making up your plots. As analytical methods are growing more sophisticated, and data sets are becoming larger, reproducibility is getting both more important and easier to do.
It is getting more important as basic data manipulations, that could be easily explained in words in the past, are becoming too intricate to be explained in details. When analyses are conducted on large datasets that require programmatic modification of their content, or when analyses rely on numerous interacting options used by a software, it often easier to provide readers the scripts that have been used to generate the datasets, statistics or figures included in the manuscript.
It is also getting easier to do as the programming languages commonly used in science provide effective ways to integrate the text for the manuscript and the code used to generate the results. This approach coined literate programming is exemplified in Python with the iPython notebooks, and in R with Rmarkdown and knitr. While these technologies have the potential to accelerate science and make results more robust and more transparent, they are typically not taught as part of the traditional university curriculum.
To me, the largest advantage of making my science reproducible and using literate programming is that it saves me a lot of time by automating my workflow. I do not have to worry about remaking figures manually or re-creating intermediate data sets when new data comes in or if errors are detected in the raw data. All of these outputs can easily be regenerated by running scripts.
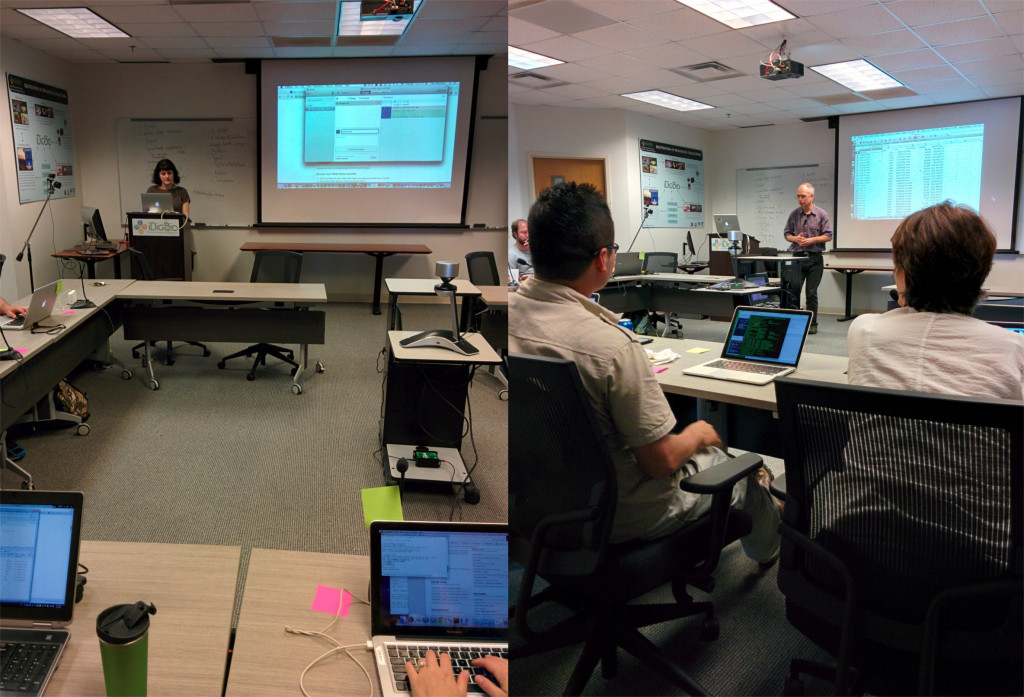
On June 1st and 2nd, 2015, 21 people (including 5 remote participants) participated in the second Reproducible Science Workshop organized at iDigBio. The instructors were Hilmar Lapp (Duke Genome Center), Ciera Martinez (UC Davis), and myself (iDigBio). The helpers (Judit Ungvari-Martin, Deb Paul, Kevin Love) ensured that the workshop was running smoothly and assisted participants as needed.
Who were the participants?
Before the workshop, we asked participants to fill out a survey to get a sense of our audience and to assess what they were expecting from the workshop.
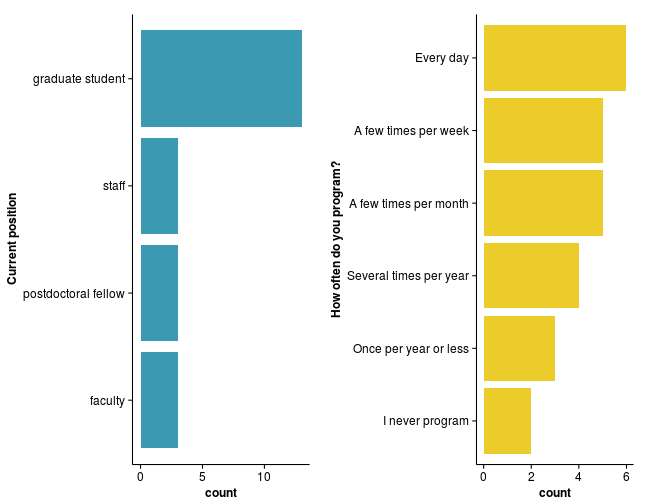
Most of the participants were graduate students from the Life Sciences who program everyday (but some programmed rarely), and almost all of them use R regularly (17 out of the 22 respondents[1]).
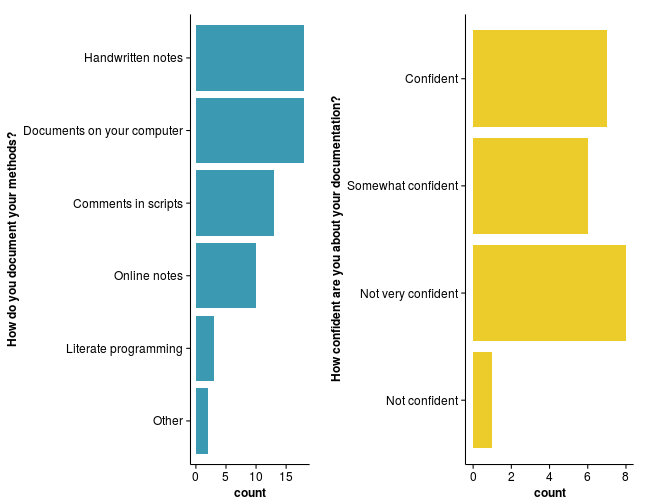
We also asked participants how they currently record their data and whether they feel confident that one of their colleagues could reproduce results and figures given the data and their notes. Most people reported using a lab notebook or online documents. The majority reported being “confident” or “somewhat confident” that their documentation was sufficient for their colleagues to reproduce their results, but nearly half the participants reported being “not very confident” while nobody chose the “Very confident” option.
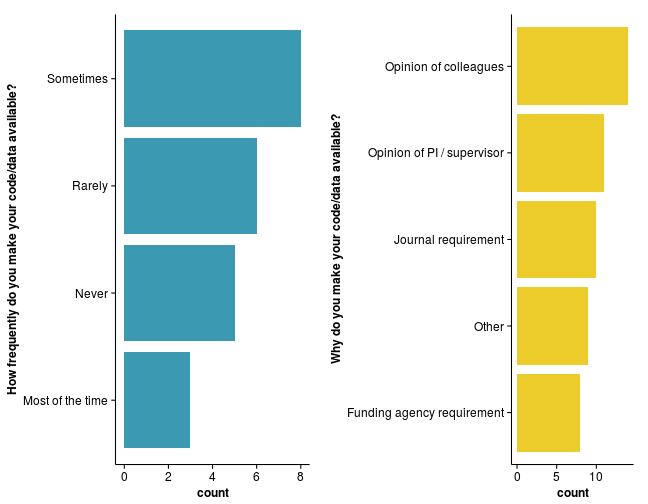
Finally, we asked participants how often they share their code/data/analysis and why they are doing it. Interestingly, “opinion of colleagues” seems to be one of the main drivers of sharing code/data/analysis. Indicating that “peer-pressure” is perceived as being more important than requirements by journals and funding agencies among the early adopters.
Organization of the workshop
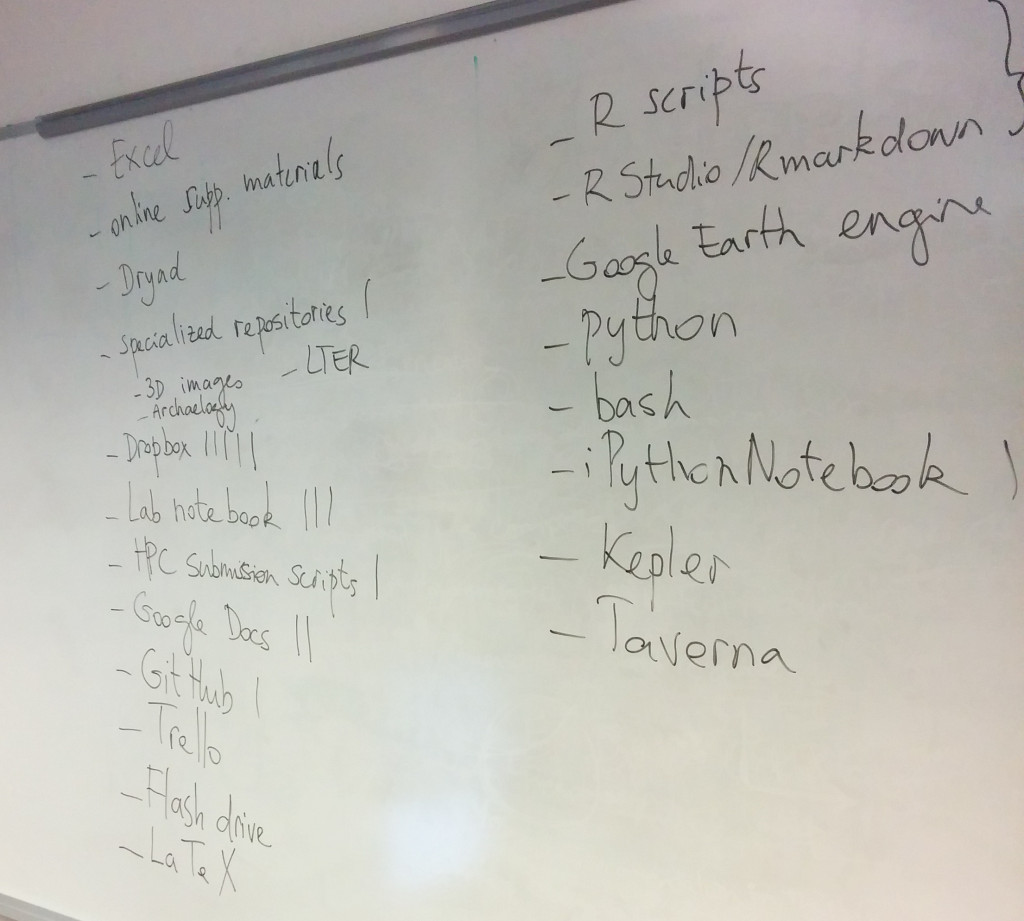
We kicked off the workshop by asking participants the tools and methods they currently use to document their analyses. Even though we asked a similar question in the pre-workshop survey, we have found that this exercise is a great way to break the ice, and get the conversation started at the beginning of the workshop.
Ciera taught a module that highlights the common challenges associated with working in a non-reproducible context. We asked participants to generate simple plots from the Gapminder dataset and to write the documentation needed to reproduce it. They then gave this documentation to their neighbors who tried to make the plots following the instructions provided. For this exercise, most participants resorted to Excel and they realized how challenging it was to write detailed enough instructions to have someone repeat a plot. After this exercise, they were introduced to literate programming in R using knitr and Rmarkdown. Participants who discovered this approach for the first time expressed that this had a certain “WOW-effect”.
In the afternoon of the second day, Hilmar introduced best practices on how to name and organize files to facilitate reproducibility, while working with a slightly more realisitic knitr document. Participants experienced the benefit of programmatic modifications of the data. Overall, this module was really well received because it provided participants with many tips and best practices to organize files in research projects.
During the first workshop at Duke, participants repeatedly requested to learn more about version control, especially Git and GitHub. Karen Cranston improvised a demonstration on the spot, but for the second workshop we came better prepared and Ciera put together a lesson (adapted from Software Carpentry) using the GitHub GUI tool. Participants clearly understood the benefit of version control, and starting with the GUI made it easily accessible to most participants. However, because of the variety of operating systems (and versions), it was difficult to provide instructions that worked for everyone, especially given that some participants had operating systems that did not support the GUI.
For the rest of the second day, François covered how to organize code into functions within a knitr document to automate the generation of the intermediate datasets, figures and manuscript. While most participants have had previous experience with R, few knew how to write functions. This was a good time to introduce them to this (sometimes) underrated approach at organizing code.
To finish off these 2 days, Hilmar covered the different licenses and publishing platforms that allow researchers to make their manuscripts, code and data publicly available. Most participants had heard of Creative Commons licenses or Dryad but few knew enough to navigate this growing ecosystem.
Overall, the workshop was well received by participants. 87% indicated in the post-workshop survey that their ability to conduct reproducible was higher or much higher than prior to the workshop.
Resources
- Wiki for the workshop
- Workshop website
- GitHub Repository for all the lessons
- GitHub Repository for this blog post
[1]: Some participants cancelled at the last minute and others who participated in the workshop didn't fill out the survey. Therefore, we don't have an exact correspondence between the number of respondents and the participants.
[2]: Thank you to Judit Ungvari-Martin for editorial suggestions.
Comments